What Is an Energy Monitoring System? How to Start Measuring Factory Power
Most factories know their electricity cost as one number on a monthly bill, but not which machines spent it, at what time, or whether it went into production or into equipment left running. An energy monitoring system turns that single number into data detailed enough to act on. This article explains how such a system works, what to measure, where to start, and the mistakes that often stop these projects delivering value.
What an energy monitoring system is, and why the bill is not enough
An energy monitoring system uses power meters installed at the main switchboard, sub-distribution boards or individual machines, and sends their readings to central software at regular intervals. The software turns this into trends, reports and alerts.
The difference from the bill is granularity. The bill gives a plant-wide total for the month. A monitoring system can tell you:
- Which machines or departments consume the most energy
- When power demand peaks during the day
- What is still running during lunch breaks, at night or on holidays
- How energy per part or per kilogram of output is changing over time
With this level of detail, energy reduction stops being guesswork and becomes a matter of choosing targets backed by evidence.
What should you measure?
1. Basic electrical values
- kWh (energy) for costing and comparing periods
- kW (power) and peak demand, which matter for plants on time-of-use or demand-based tariffs, because several large loads starting together can set a high demand figure for the whole month
- Power factor, showing whether reactive power is excessive and whether capacitor banks are doing their job
- Voltage, current and phase imbalance, which help detect power quality issues that affect motors and electronics
2. Idle and standby energy
A CNC machine that is not cutting still runs hydraulic pumps, coolant pumps, fans and its control system. Air compressors may keep loading with no production running because of leaks in the air network. Looking at the energy profile during breaks and outside working hours is usually the quickest way to find energy that adds no value.
3. Energy per unit of output
Raw kWh can be misleading: a busy month naturally uses more power. A more meaningful indicator is kWh per part or kWh per kilogram. As a hypothetical example, if a machine's energy per shift rises while its output stays flat, something has changed: longer waiting time, worn tooling, or rework from scrap. This calculation needs part counts from the machine, which is where energy data links naturally with machine monitoring.
System hardware and architecture
A typical energy monitoring system has four layers:
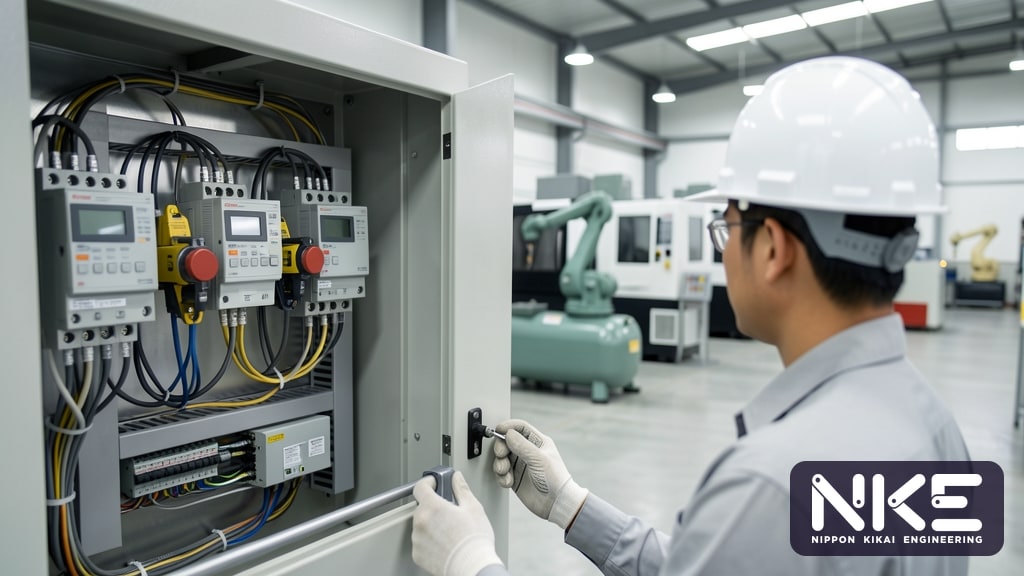
- Power meters and CTs (current transformers). The meter measures voltage directly and current through CTs. Where a panel is hard to shut down, split-core CTs can be clamped around existing cables without disconnecting them.
- Communication. Most industrial meters support Modbus RTU over RS-485 or Modbus TCP, connected to a gateway or PLC.
- Gateway / data collector, which polls the meters at a set interval and forwards the data to a database over the plant network.
- Software and dashboards for history, per-machine and per-department trends, reports, and alerts such as demand approaching a set limit or loads running outside shift hours.
Plan from day one for energy data to sit alongside production data such as machine status, part counts and shifts, so it can be analysed together with OEE rather than becoming a separate system nobody opens.
Where to start: a practical metering sequence
You do not need a meter on every machine on day one. A sequence that works well in practice:
- Main switchboard to see the overall consumption and demand profile of the plant
- Large utility loads such as air compressors, chillers, furnaces, ovens and air conditioning, which often account for a large share and run continuously
- Sub-boards per department or production line to allocate energy cost to products
- Key individual machines such as CNC machines, presses or robot cells where you want kWh per part
Before installing anything, write down the questions you want answered, for example cutting peak demand or finding idle consumption. Those questions decide which points to meter and how often to log. Any work inside electrical panels must always be done by qualified electricians following the plant's safety procedures.
Common mistakes in energy monitoring projects
- Wrong CT ratio or CTs installed in reverse, giving wrong or negative readings. Verify against a portable meter after installation.
- Metering only the main incomer. You see high consumption but not where it comes from, so there is nothing specific to fix.
- No production context. kWh moves with output; without normalising by production it is easy to misread.
- Logging interval that does not fit the question. Daily energy trends tolerate coarse logging, but demand analysis needs data frequent enough to capture peaks.
- Unsynchronised clocks, which make energy and machine data impossible to align. Sync time from a single source.
- Dashboards without an owner. Assign responsibility, a review routine and defined actions for abnormal values, in line with the QCDESM view of cost and environment as plant KPIs.
FAQ
Can older machines be fitted with energy monitoring?
Yes. Energy is measured on the machine's incoming supply with a power meter and CTs, so there is no need to connect to the machine's control system. It works with almost any make or age of machine.
Can energy data be combined with OEE or machine monitoring?
Yes, and it should be. Knowing machine status (running, stopped, waiting) alongside energy for the same period lets you separate energy used for real production from energy lost while idle, and calculate kWh per part.
Do we need to shut down the whole plant to install it?
It depends on the metering points and the condition of the panels. Split-core CTs reduce the need to disconnect cables, but voltage connections and any panel work still need to be planned with maintenance and carried out under proper electrical safety procedures.
NKE designs and installs factory data systems, including machine monitoring, OEE and energy monitoring, as part of our factory automation work. If you want to start collecting energy data from the points that matter most in your plant, contact the NKE team, call 02-746-7196 or add LINE @nke.th to discuss your requirements.